Image from “Return to the Isle of Ted,” PS: Political Science and Politics (July 2020)
In my team-taught, interdisciplinary course on climate change, my priority in my political science section was to help my students understand collective action problems—when people fail to successfully work together to achieve common goals. Our major in-class activity drew from a classic collective-action simulation called “The Isle of Ted,” which I modified by including additional components like fishing and increased pirate attacks to make the activity mirror the problems of climate change. This modification, “Return to the Isle of Ted,” was published in the journal PS: Political Science and Politics by Cambridge University Press!
Let me explain a little more about why I added fishing to the original Isle of Ted simulation. Climate change is difficult to solve because it involves a major collective action problem: overusing common-pool resources to the point of destruction. Common-pool resources are a fancy name for forests, oceans, and the atmosphere—these are all resources that are non-exclusive (anyone can access and use them) but limited in quality and quantity (they can be overused, depleted, and eventually destroyed). The original Isle of Ted simulation did well at explaining collective action problems surrounding public goods (in the game, represented by roads and defense), but it did not have a common-pool resource. The introduction of fishing (a common-pool resource) allowed for post-game discussion of two essential concepts related to the problem of climate change: the difficulty of protecting common-pool resources, and the ethical responsibilities of early versus late developers.
The way the fishing worked was simple: each of the six groups were able to launch between zero and four fishing boats each turn. Each boat cost the group one point, but each fish returned would earn the group a point. The fishing population initially returned two fish for every one boat, making it clear to the students as a whole that fishing was lucrative and that the best strategy was to maximize their fishing boats each turn. Not announced in class was the fact that the fish were limited in quantity, but this became obvious as the simulation progressed and the fishing ratio began to decrease.
To make the fishing ratio easy to calculate, I created an Excel spreadsheet, which I shared online with the publication of the article. However, I neglected to explain a crucial facet of this spreadsheet: that there is an extra depletion of fish per turn (built into the mathematical equation) to speed up the overfishing for teaching purposes! This omitted explanation came to my attention when a fellow professor emailed me for guidance on how to run the simulation in his own classroom, writing:
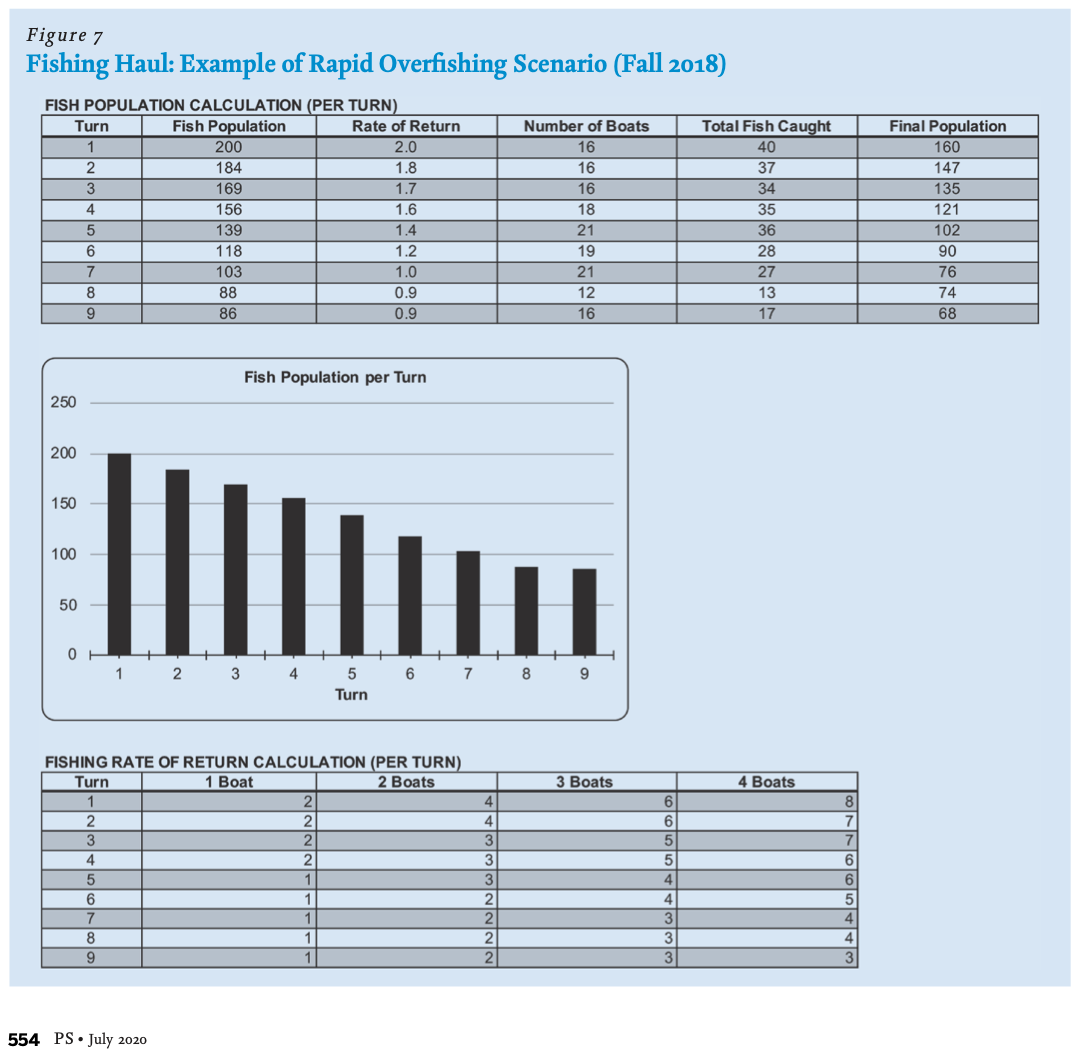
“When you write about the fishing ‘rate of return’ you mention that the rate of return is equal to the # of fish/100 (so it starts out with a rate of return of 2 fish (points) for every boat. Yet, in your examples (Figure 6) you show that, in turn one, 14 boats were sent out, and with a rate of return they ‘caught’ 35 fish. I’m just curious how you got that number of fish (clearly I’m missing something in my reading). As I see it, wouldn’t it be 28 fish caught (14 boats with a 2.0 rate of return). Any clarification you could provide would be greatly appreciated.”
When I received this note, I looked back at my materials and notes from when I first developed this modified simulation in 2018. In the Excel spreadsheet, the “Total Fish Caught” column (column F) has an equation that multiplies the Number of Boats by Rate of Return and THEN multiplies this result by an extra 1.25. This equation results in a fishing haul of 35, as in the scenario described above. I made this adjustment to ensure that within the time constraints of a class (it takes about an hour to get through 10 rounds!), the consequences of overfishing would be noticed by the group. In my experience, the game worked better as a learning model for individual exploitation of common goods when the fishing population craters quickly.
Unfortunately, because I made this adjustment in 2018 to ensure the desired result in the scenario (and then forgot about it), I didn’t think to add a brief explanation in the text of the article about why 2×14 = 35. (And despite the thorough peer review process, no one else thought to ask about this either! Sigh…) So, I reached out to the editors of the journal to see if I could provide an updated Excel spreadsheet with an explanatory note for the online supplementary materials, but (oh, academia) the Managing Editor apologetically let me know that Cambridge “cannot edit a published article nor the supplemental material for a published article.”
The best that I can do is make available here my updated Excel spreadsheet with the following explanatory note for Column F:
“Please note that the “Total Fish Caught” column (column F) includes an equation that multiplies the Number of Boats by Rate of Return and THEN multiplies this total by an extra 1.25. This extra bump is pedagogical: within the time constraints of approximately 10 rounds of gameplay, the 1.25x bump ensures that the consequences of overfishing are noticed by Round 5. Teachers can adjust the equation to suit their pedagogical needs (making the consequences more or less dramatic), but without the 1.25x bump, it takes too many rounds for overfishing to result in less than 1 fish per boat (which reduces the pedagogical value).”
At least I was able to clarify the situation for my fellow professor! And he kindly let me know that the “simulation was actually quite a hit for accepted student day here on campus. . . . The added fishing component really brought another layer to the simulation – so thanks again for developing it.” Thanks for the positive feedback, and I’m glad it worked for you!